The operations section of the monitoring dashboard shows network activity and API call volume for your project. It is labeled Beta in the Cloud UI. You can filter all charts by index using the All indexes dropdown, set a date range, or enable real-time mode. Timestamps are displayed in UTC.

Bandwidth

The bandwidth chart shows the volume of data transferred in and out of your project, displayed in megabytes (MB).
Bandwidth chart showing inbound and outbound data transfer in MB over time
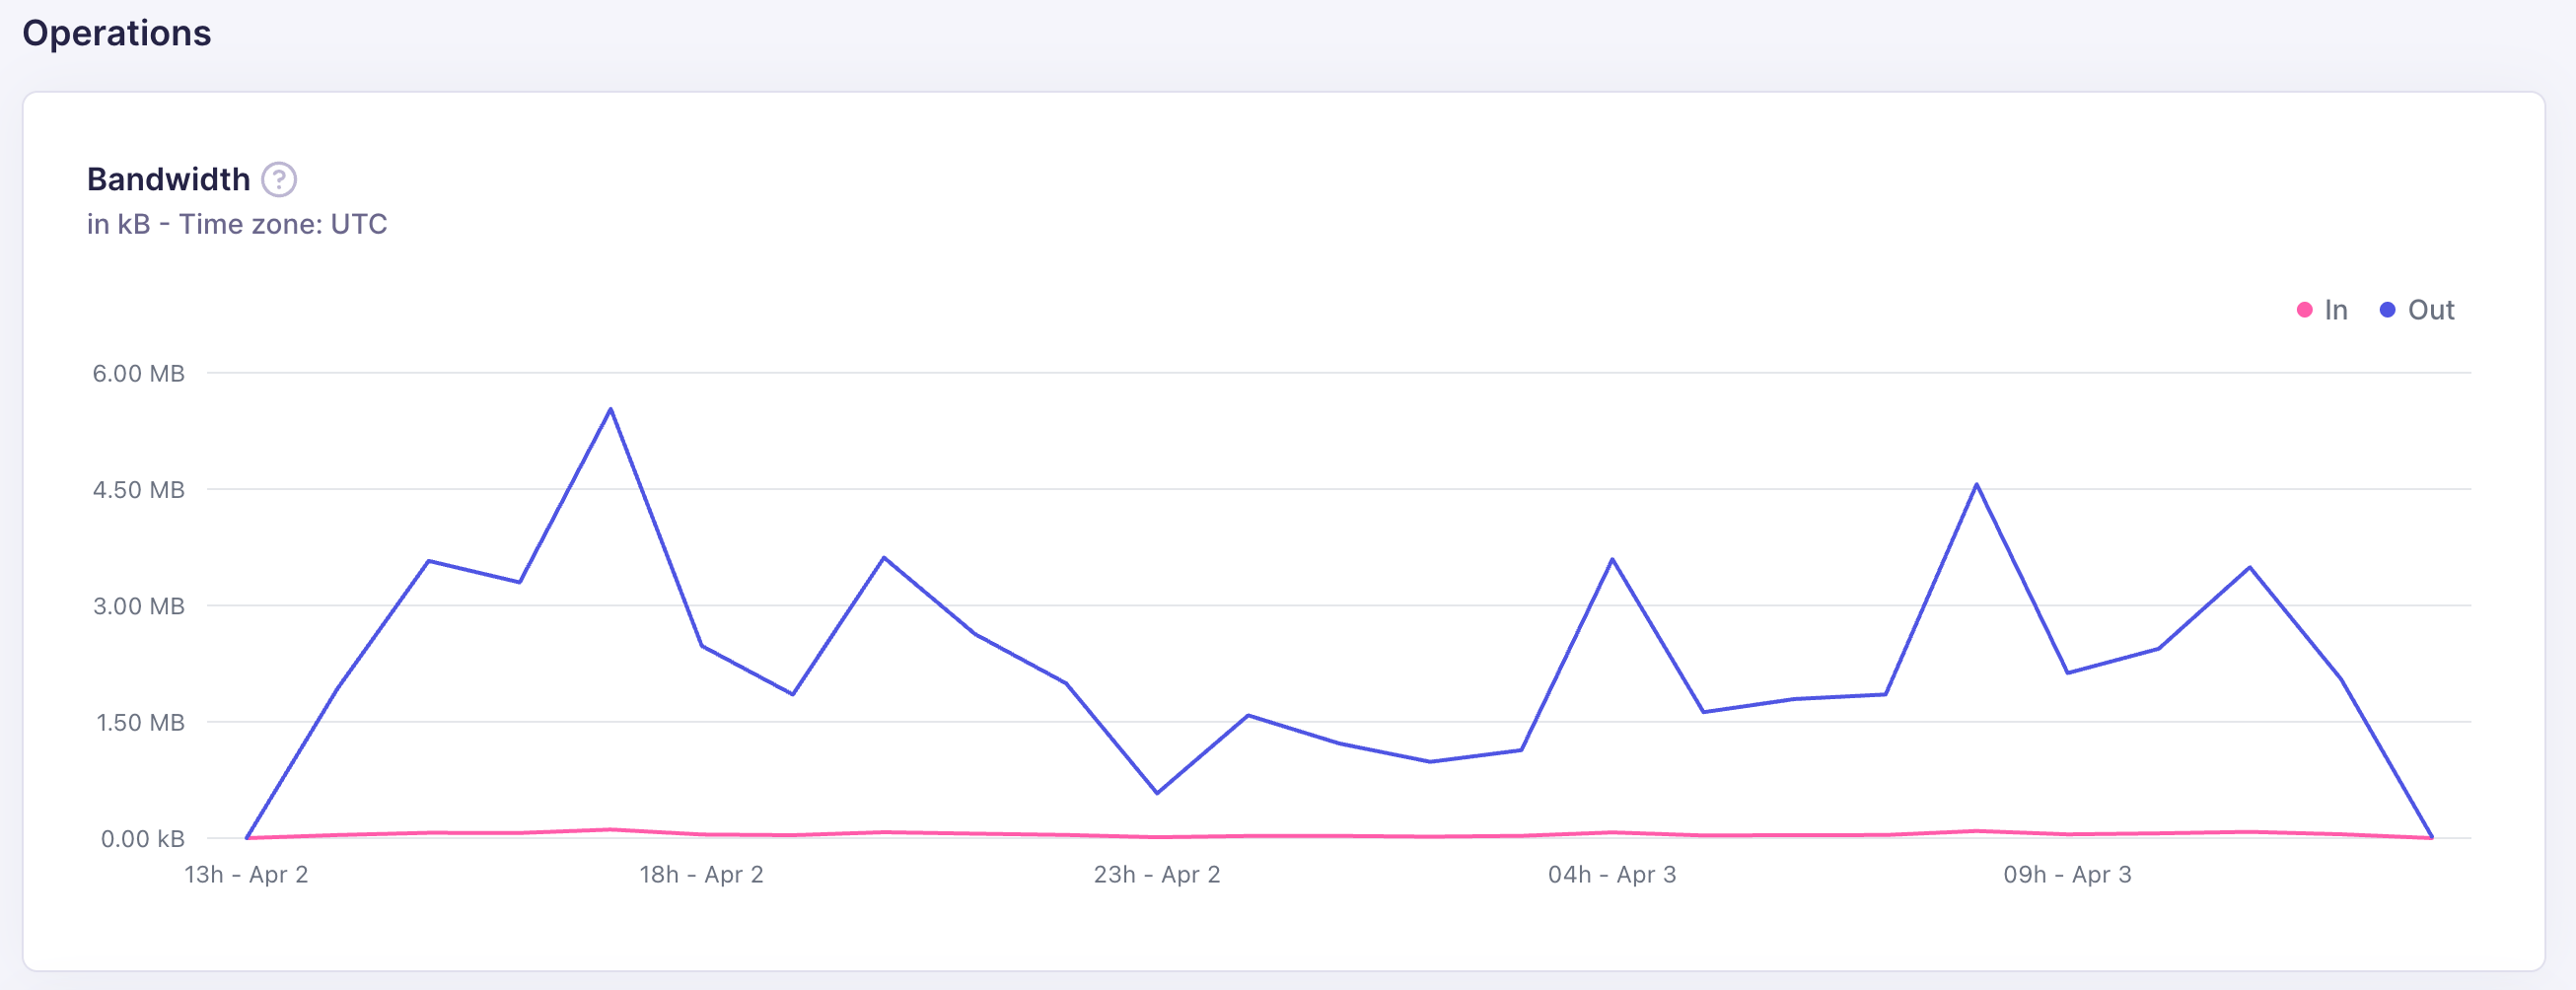
  • In: data sent to Meilisearch (document additions, updates, settings changes)
  • Out: data returned by Meilisearch (search results, document fetches)
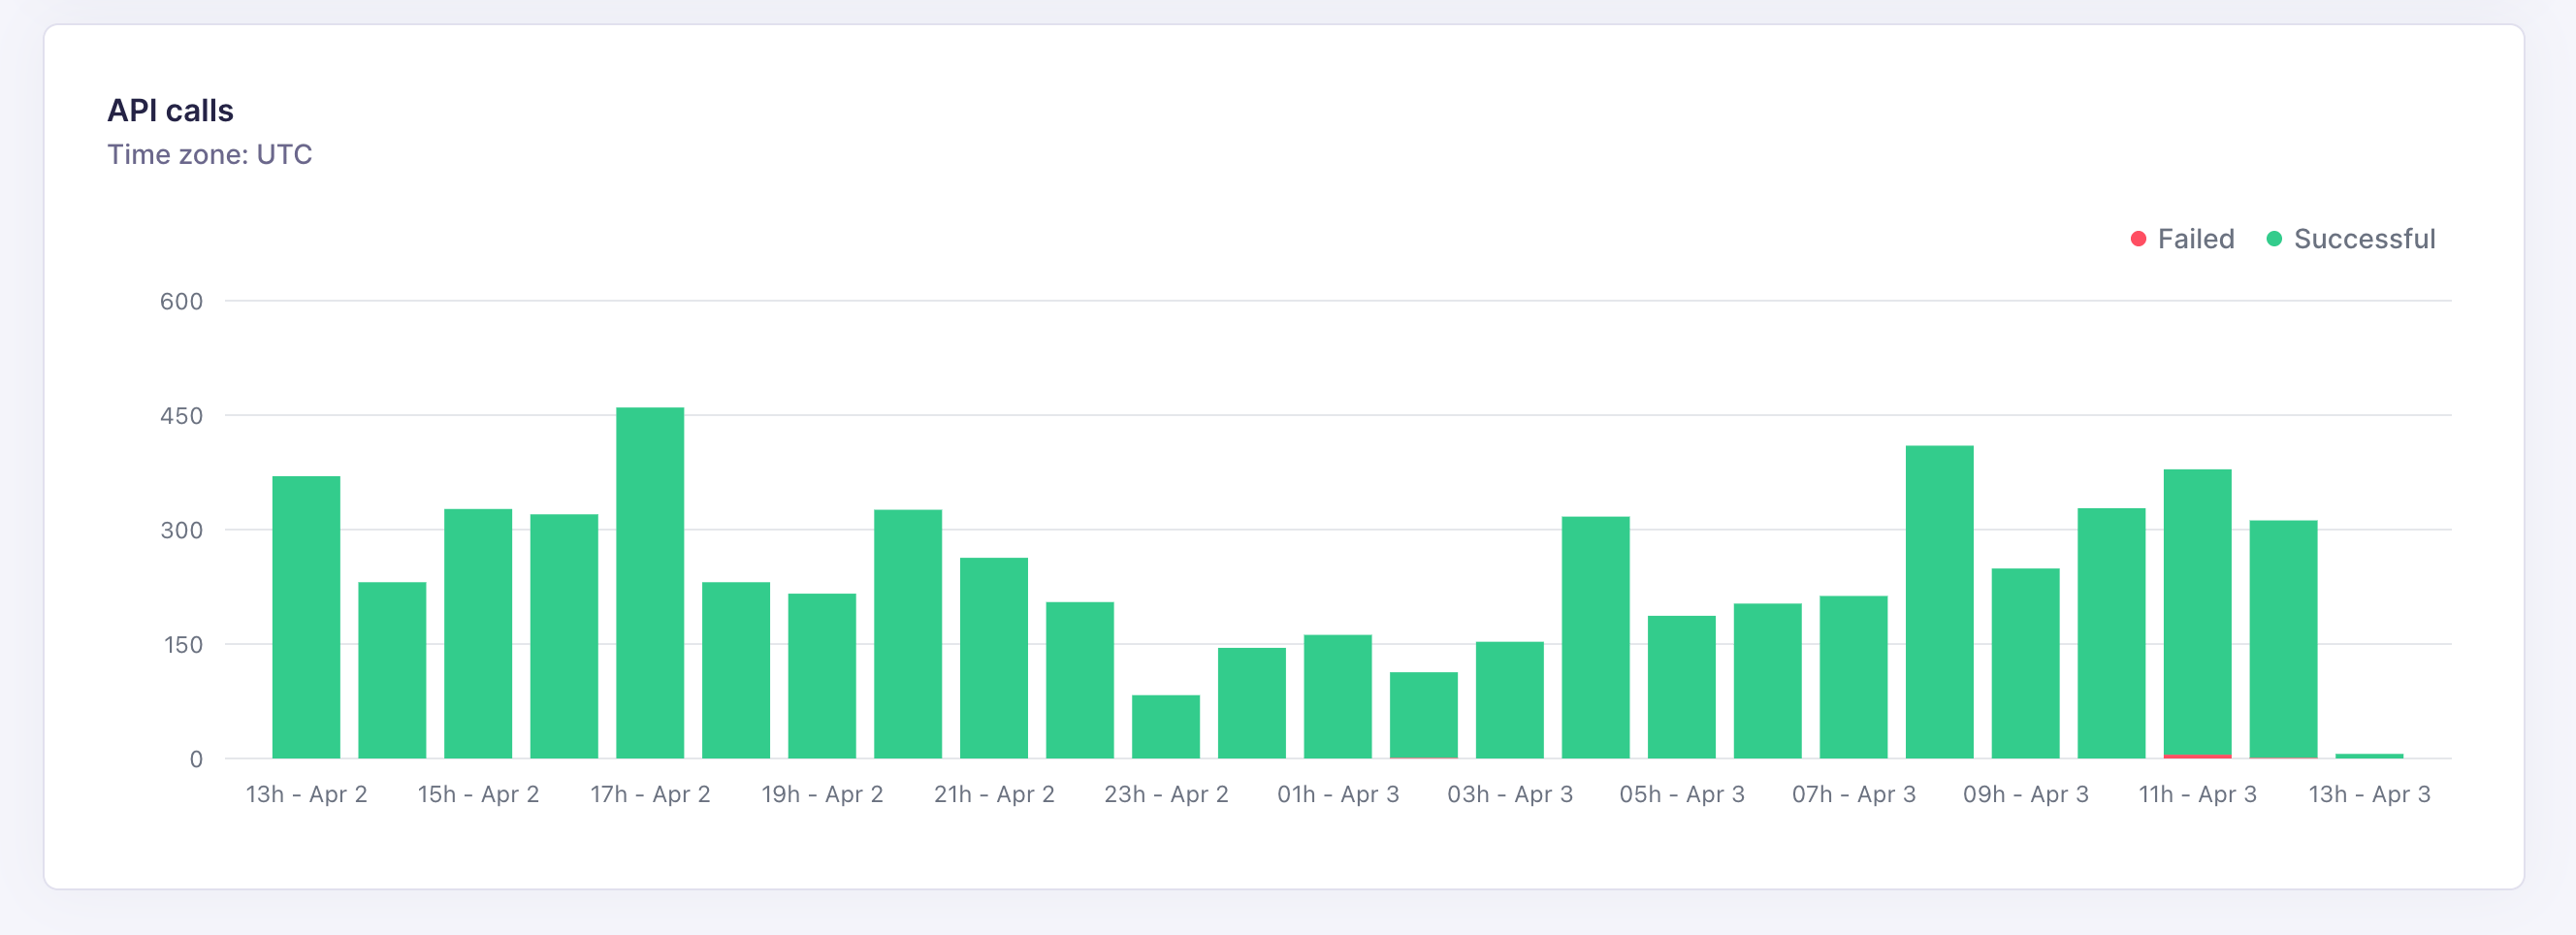
Outbound bandwidth is typically much higher than inbound for read-heavy workloads. A sudden increase in inbound bandwidth usually corresponds to a large indexing operation.

API calls

The API calls chart shows the number of requests to your project’s API, broken down into Failed and Successful calls.
API calls bar chart showing failed and successful requests over time
A healthy project should have near-zero failed calls. Common causes of failed API calls:
CauseFix
Expired or invalid API keyRotate the API key in your project settings
Malformed request payloadCheck your application’s request construction
Rate limit exceededReduce request frequency or upgrade your plan
Index does not existVerify the index name in your application